We learn from Amanda Amroliwala, CEO for the Parliamentary and Health Service Ombudsman, that PHSO ‘count in complex ways’. It is certainly true that they alter the way they count, as well as the terminology used to describe complaints. on a regular basis, making it difficult to monitor their performance year on year.
For some time PHSO used the terms ‘complaint’ and ‘enquiry‘ interchangeably, but in 2018/19 they clarified their use of terminology following a request to do so from Rupa Huq MP who was at that time a member of the PACAC select committee. (see below)
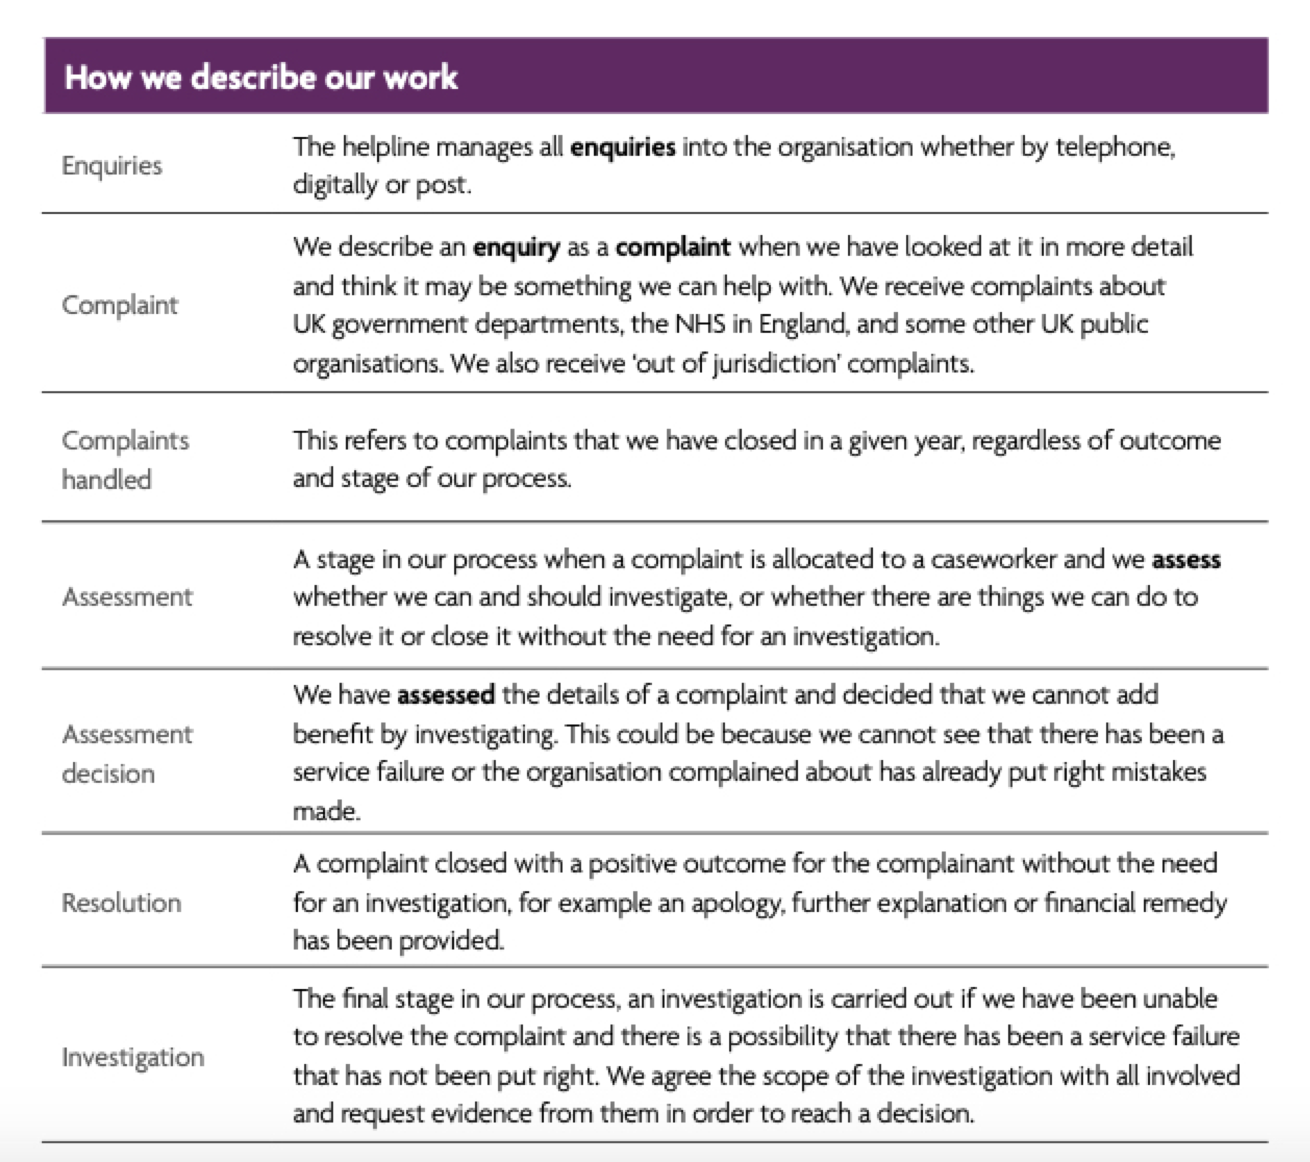
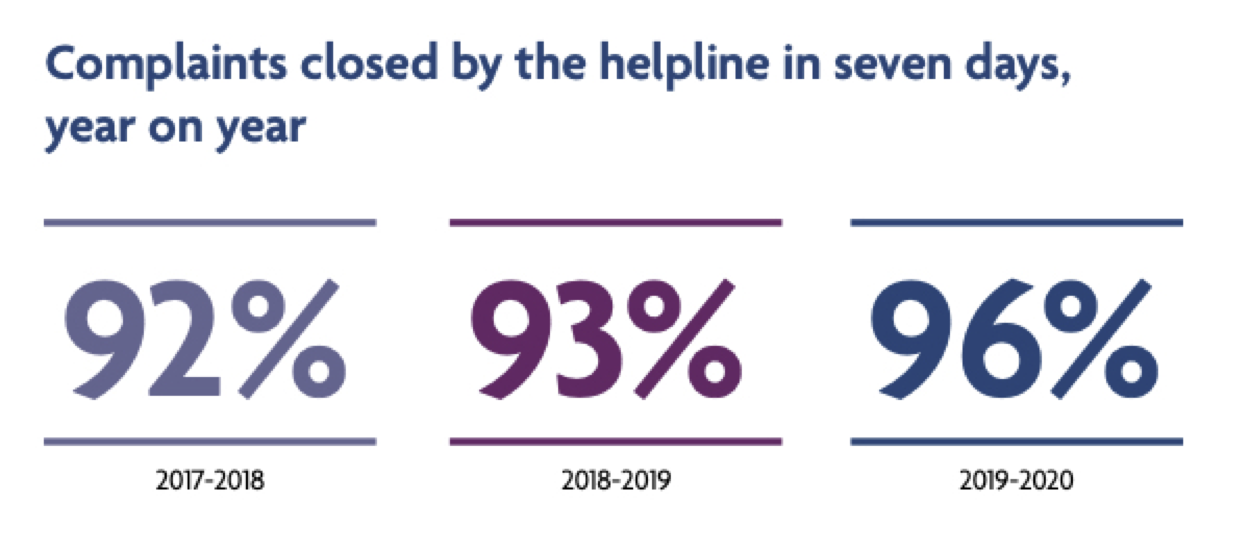
Starting with ‘enquiries’ – this term refers to all contact with the Ombudsman. Some of this contact could be a simple request for information, but the chances are that most people don’t contact the Ombudsman until they are ready to make a complaint. The Ombudsman helpline staff are ‘exemplary’ at closing down as many of these enquires as they can within 7 days. Just look at their improvement over time, as proudly recorded in the 2019/20 Annual Report.
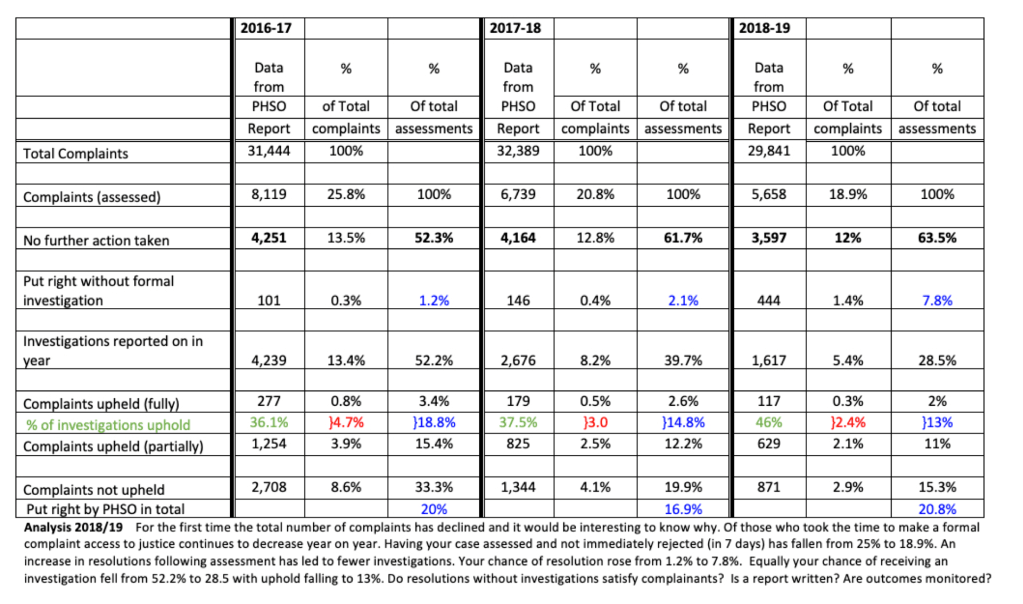
By 2019/20 there was only a 4% chance you would move beyond ‘enquiry’ to an ‘assessment’ of your complaint by a caseworker. From this assessment, a few ‘lucky’ people receive a ‘resolution’ each year, which is, according to PHSO, a positive outcome for the complainant without a full investigation. Most assessment decisions lead to dismissal of your complaint, but if you are very fortunate, you may find that your complaint deserves a full investigation – hooray.
Many more months down the road the majority of these investigations will lead to absolutely no uphold whatsoever, with just a few given a partial uphold and an even smaller number given a full uphold.
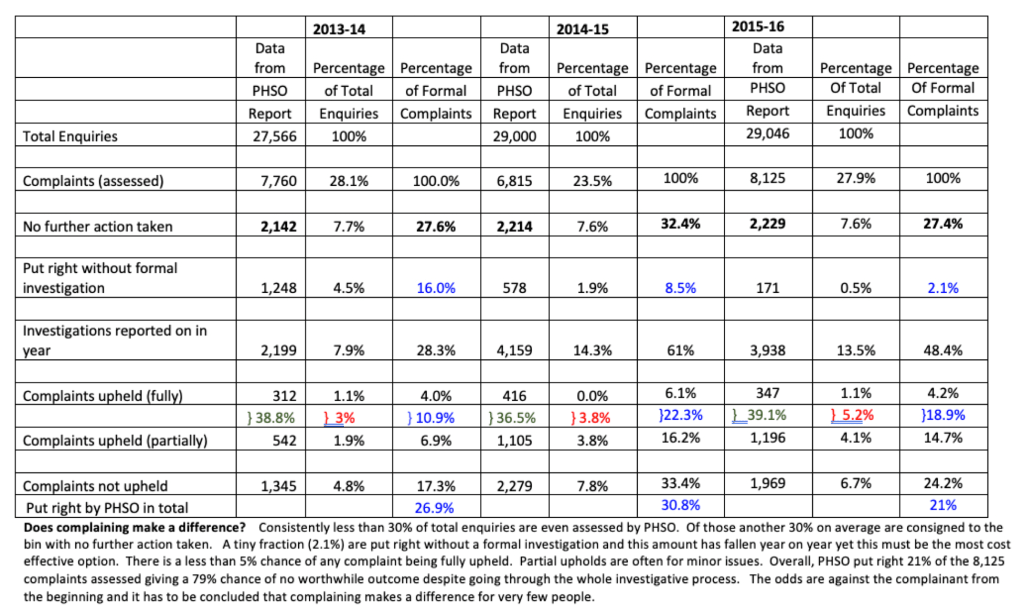
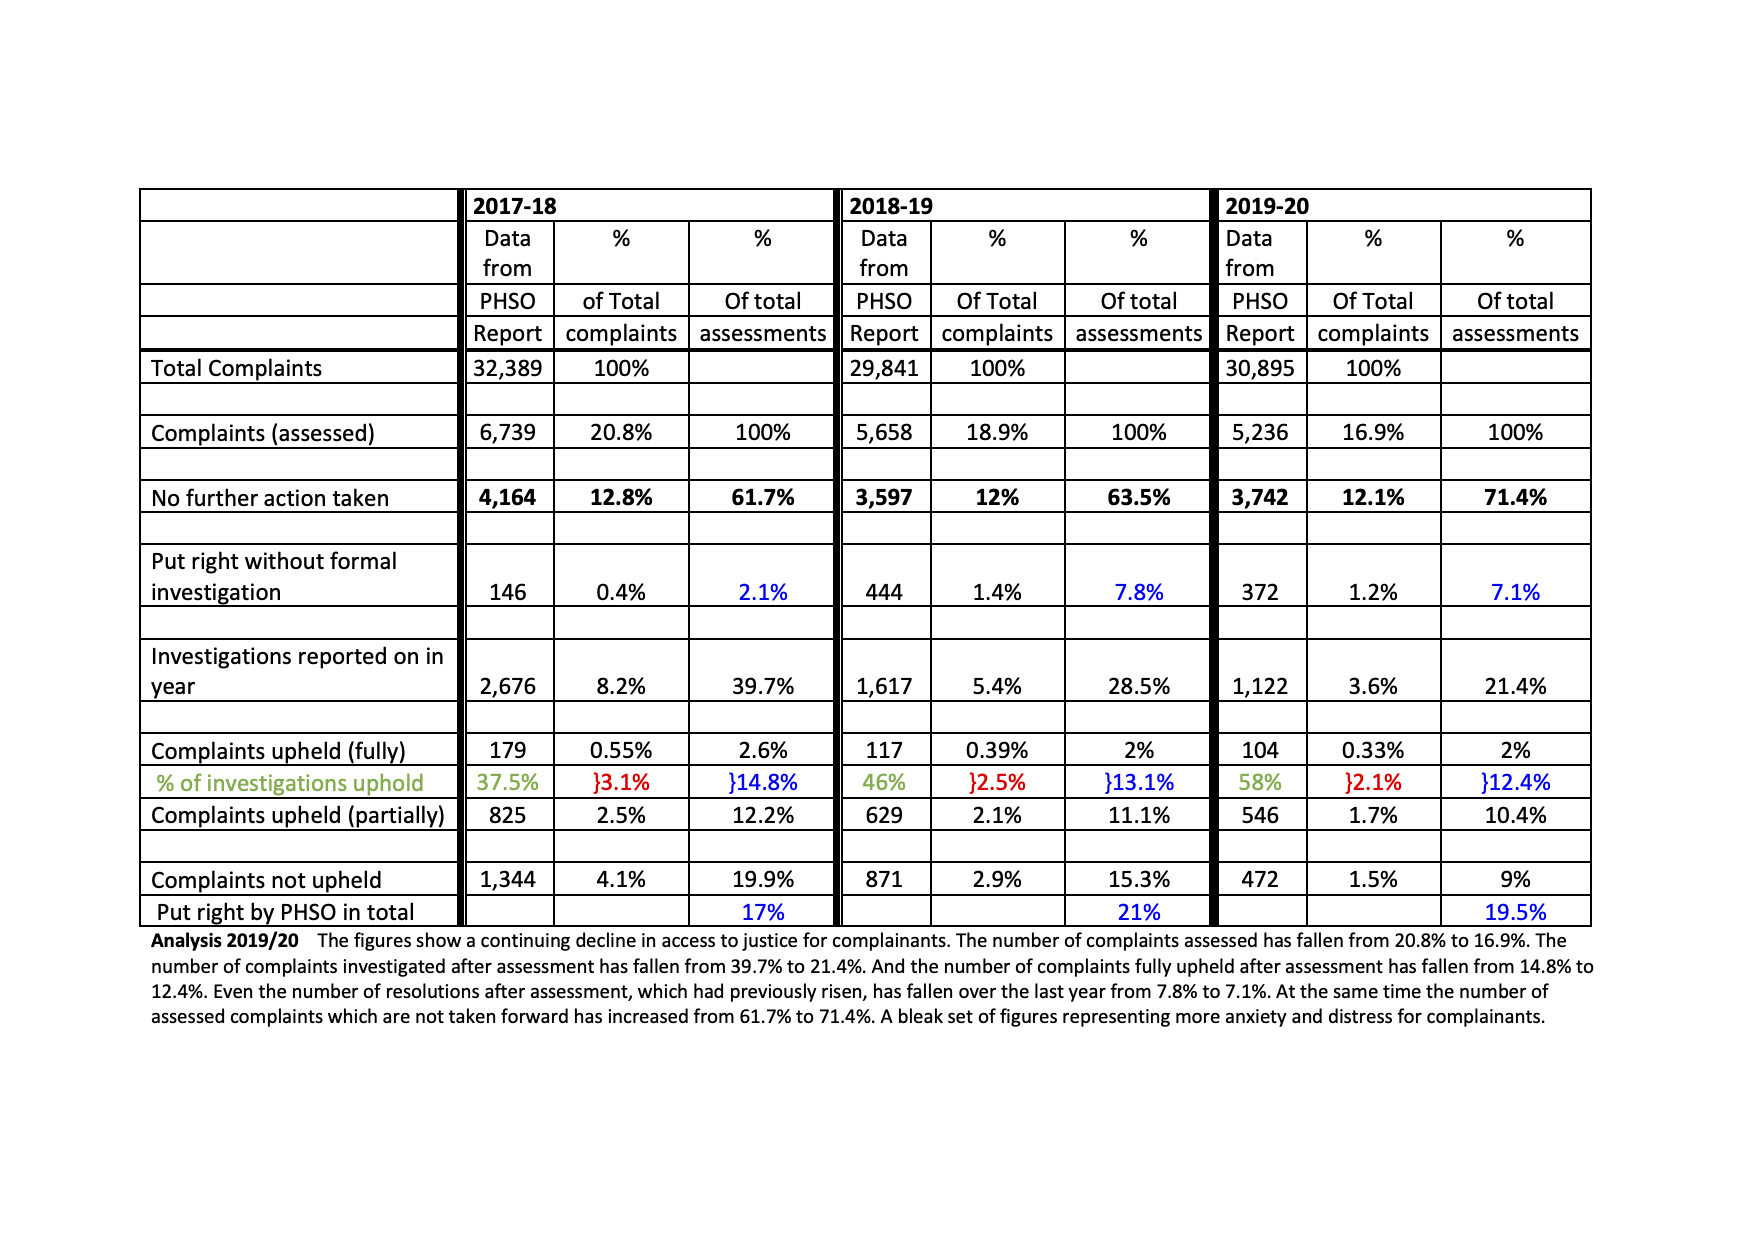
As Ombudsman watchers PHSOtheFACTS compile the data each year from the PHSO Annual Report. We try to compile it in the same way so that progress over time can be more easily monitored. We start with total complaints/enquiries. It is interesting to see that the total number of complaints decreased for the first time in 2018/19. The vast majority of these complaints are dismissed, and many people find they must return to the public body who has been giving them the run-around on the basis their complaint is ‘premature’. As it is not possible to distinguish complaints from enquiries at this stage, those cases which are ‘assessed’ by a caseworker are classed as accepted, legitimate complaints. As you can see from 2018/19 over half of these assessments lead to a dismissal of the case. In our chart, ‘put right without formal investigation’ equates to ‘resolution’. Fewer than 10% of assessments lead to a resolution.
The green percentage figure indicates the number of upholds in relation to the number of investigations carried out. This is the figure most often used by the Ombudsman, as it is the highest uphold percentage rate. When you reduce the number of investigations, as happened under Rob Behrens leadership, the uphold percentage increases even though fewer actual complaints are upheld.
The red percentage figure shows the number of upholds in relation to all the enquiries/complaints submitted. On the basis that the vast majority of people contacting the Ombudsman would be looking for such an outcome, this extraordinarily low and decreasing uphold figure shows just how many people are wasting their time.
The blue percentage figure shows the number of upholds in relation to all those cases which were assessed by a caseworker, therefore, accepted as legitimate complaints and not enquiries, or premature cases.
It may be useful to know that Dame Julie Mellor became the Ombudsman in 2012 and initiated a ‘more impact for more people’ policy which saw an increase in investigations from 2013 onwards. She was replaced in 2017 by Rob Behrens, who simply reversed the policy with a ‘back to basics’ agenda. Presumably, the basics being to close as many cases as quickly as possible.
This chart brings us right up to date.
The number of upheld complaints falls from 3.1% to 2.1% in the red figures, which are a percentage of total complaints made. The number of investigations reported on falls from 8.2% of all complaints to just 3.6%. Because fewer investigations were carried out (2,676 down to 1,122) the percentage of upheld investigations rises from 37.5% to 58%. (green figures). If you get past the 7-day purge and receive an assessment of your complaint, you have approximately 20% chance of some form of positive outcome.

A steady decline in all services seems to make for an exemplary Ombudsman.
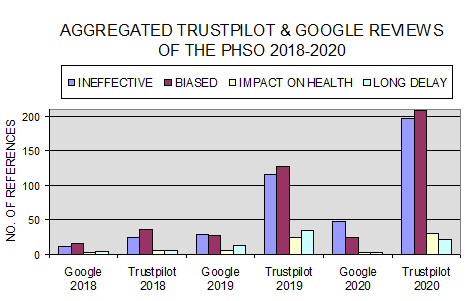
As PHSO performance decreases, complaints from the public increase via google and Trustpilot reviews.